
A website can respond quickly where you are and take much longer for someone on another continent. I built Flying TTFB to see that difference in one test. Enter any public URL and it measures Time to First Byte from 22 locations around the world.
What Is TTFB?
Time to First Byte (TTFB) is how long it takes to receive the first byte of a response. In this test, that includes DNS, connecting, setting up TLS, and waiting for the response to start. The rest of the page still needs to download and render.
How to Test TTFB From Multiple Locations
- Enter the URL. Paste the final HTTPS address into Flying TTFB and click Test. Try your homepage, a blog post, or a product page.
- Compare locations. The map shows where the test ran. Each result shows TTFB, the HTTP status, and the CDN cache status when available. Start with the locations where most of your visitors are.
- Open a slow result. Expand the row to see how much time went into DNS, the connection, TLS, and waiting for the first byte. The response headers are right below the timings.
I Tested WP Speed Matters
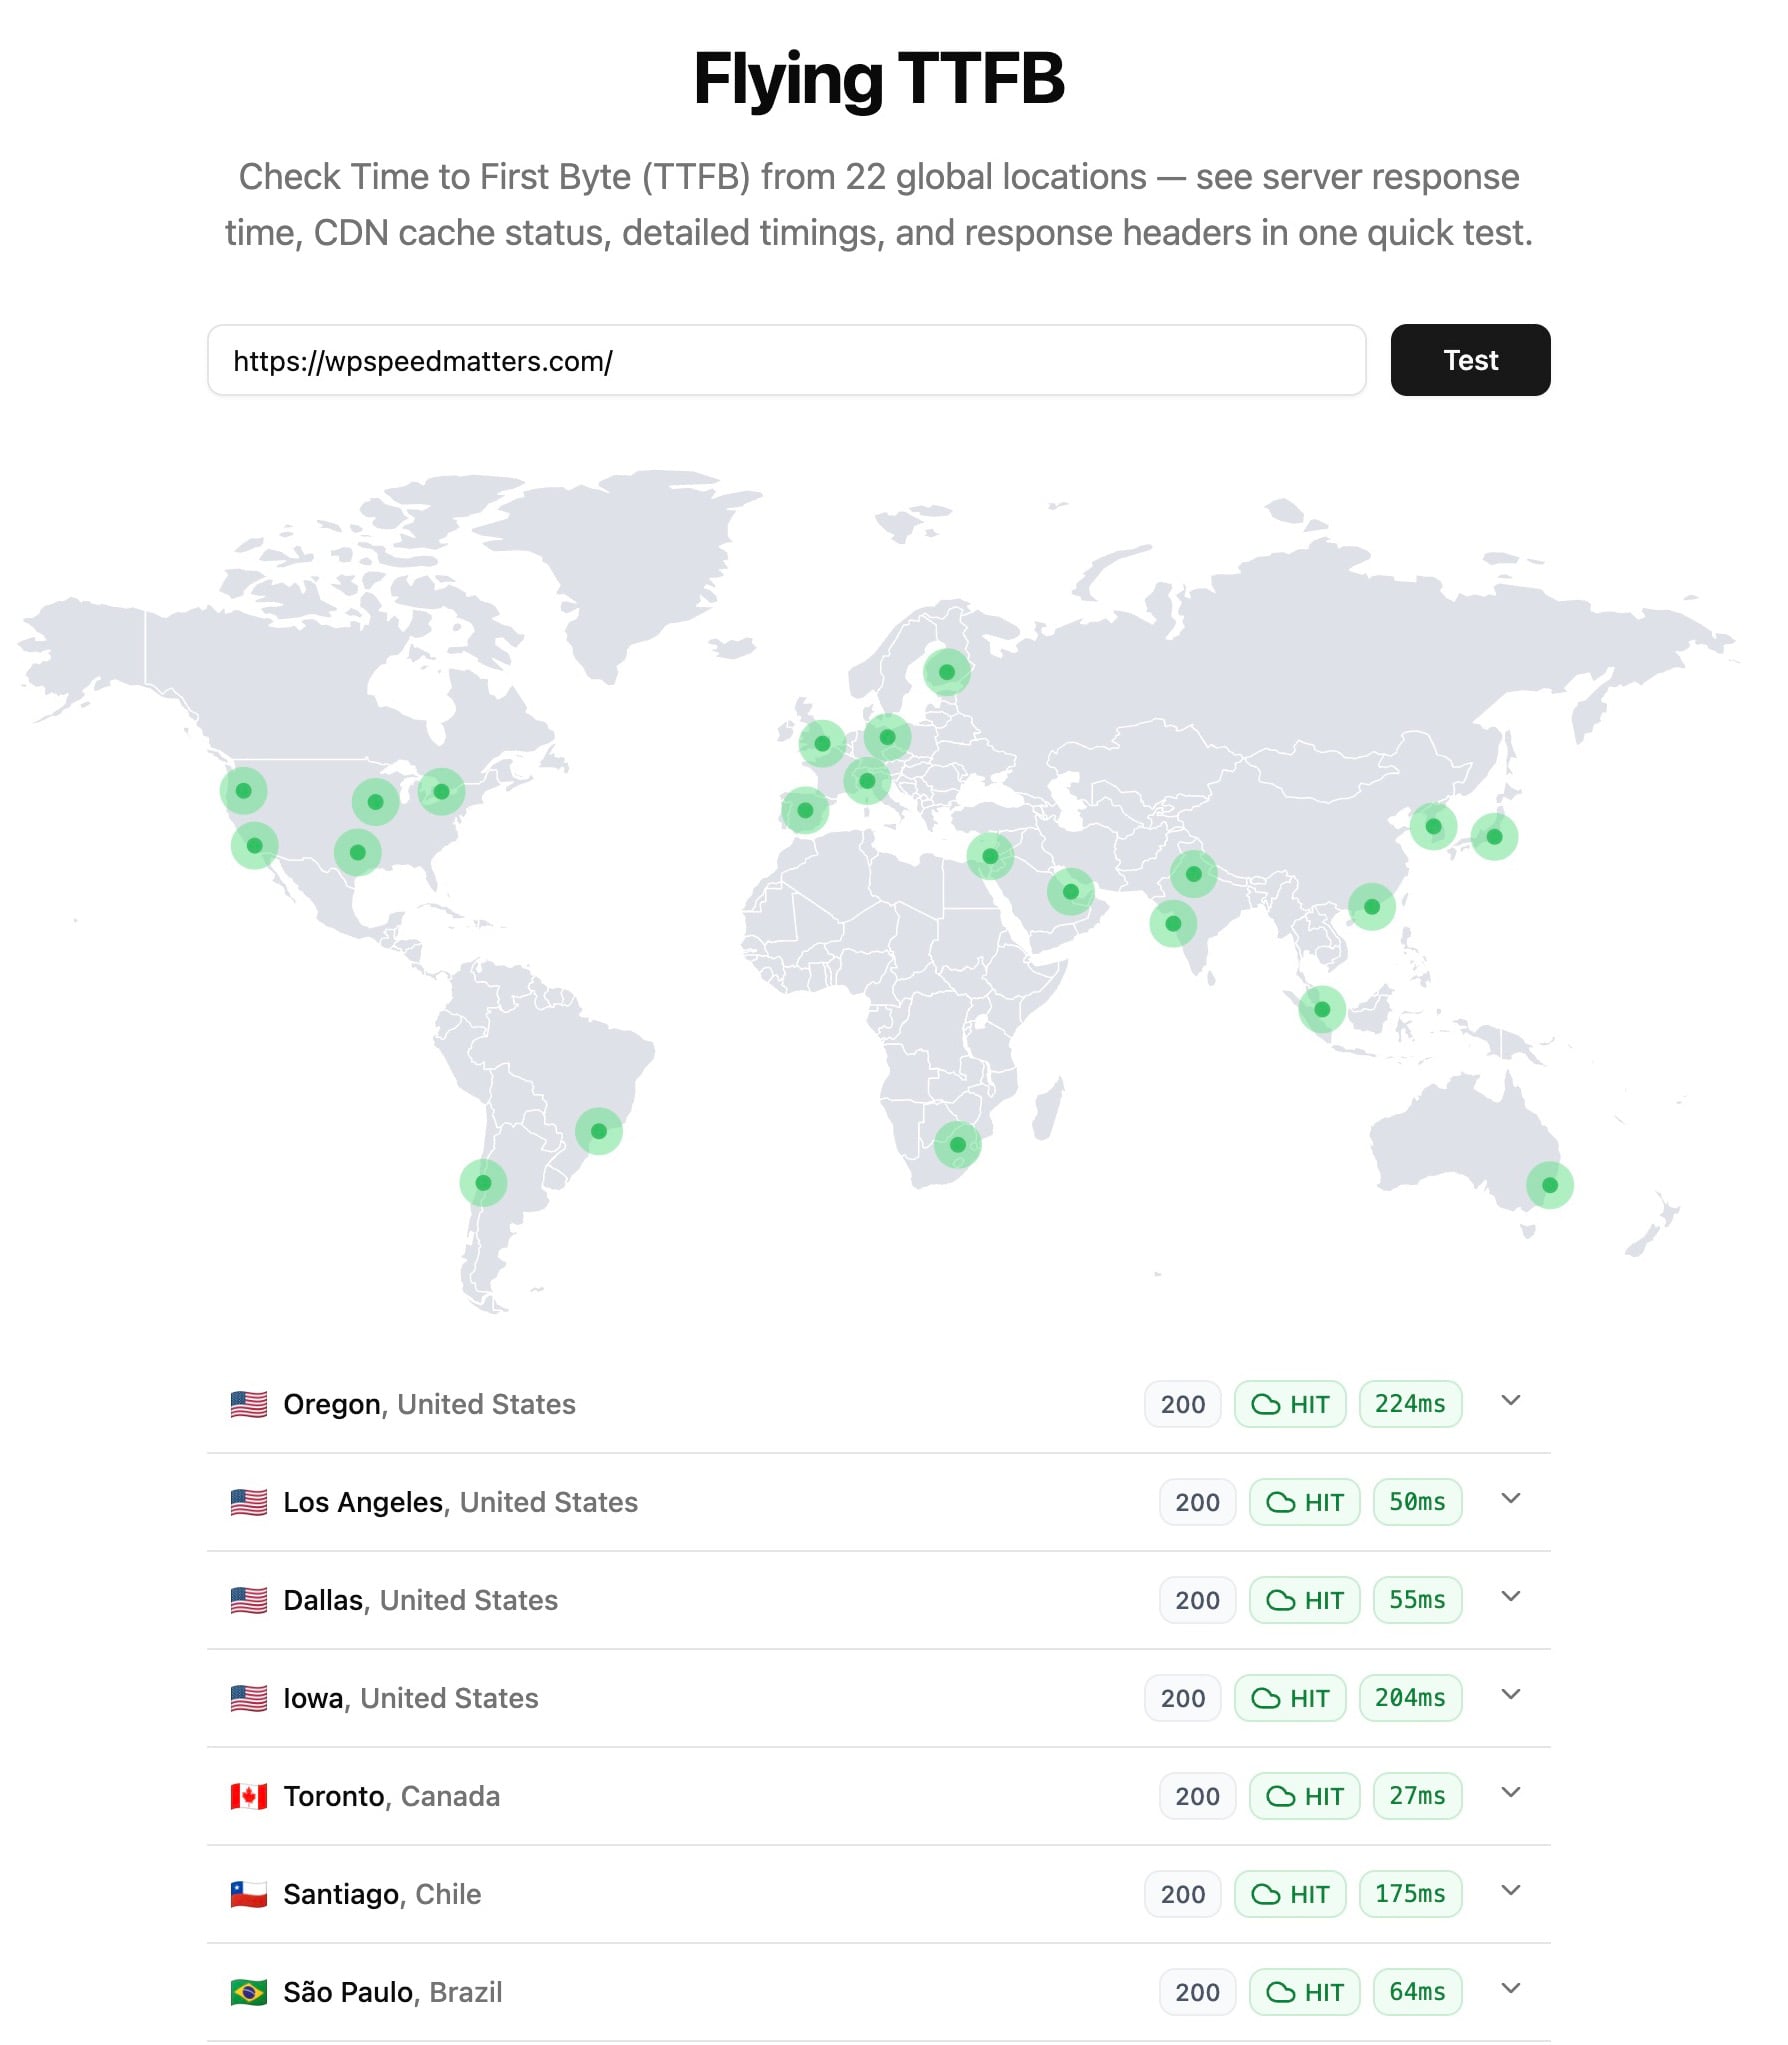
I ran the homepage through Flying TTFB. Toronto came in at 27 ms and Doha at 249 ms. All 22 locations returned HTTP 200 and showed a cache hit.
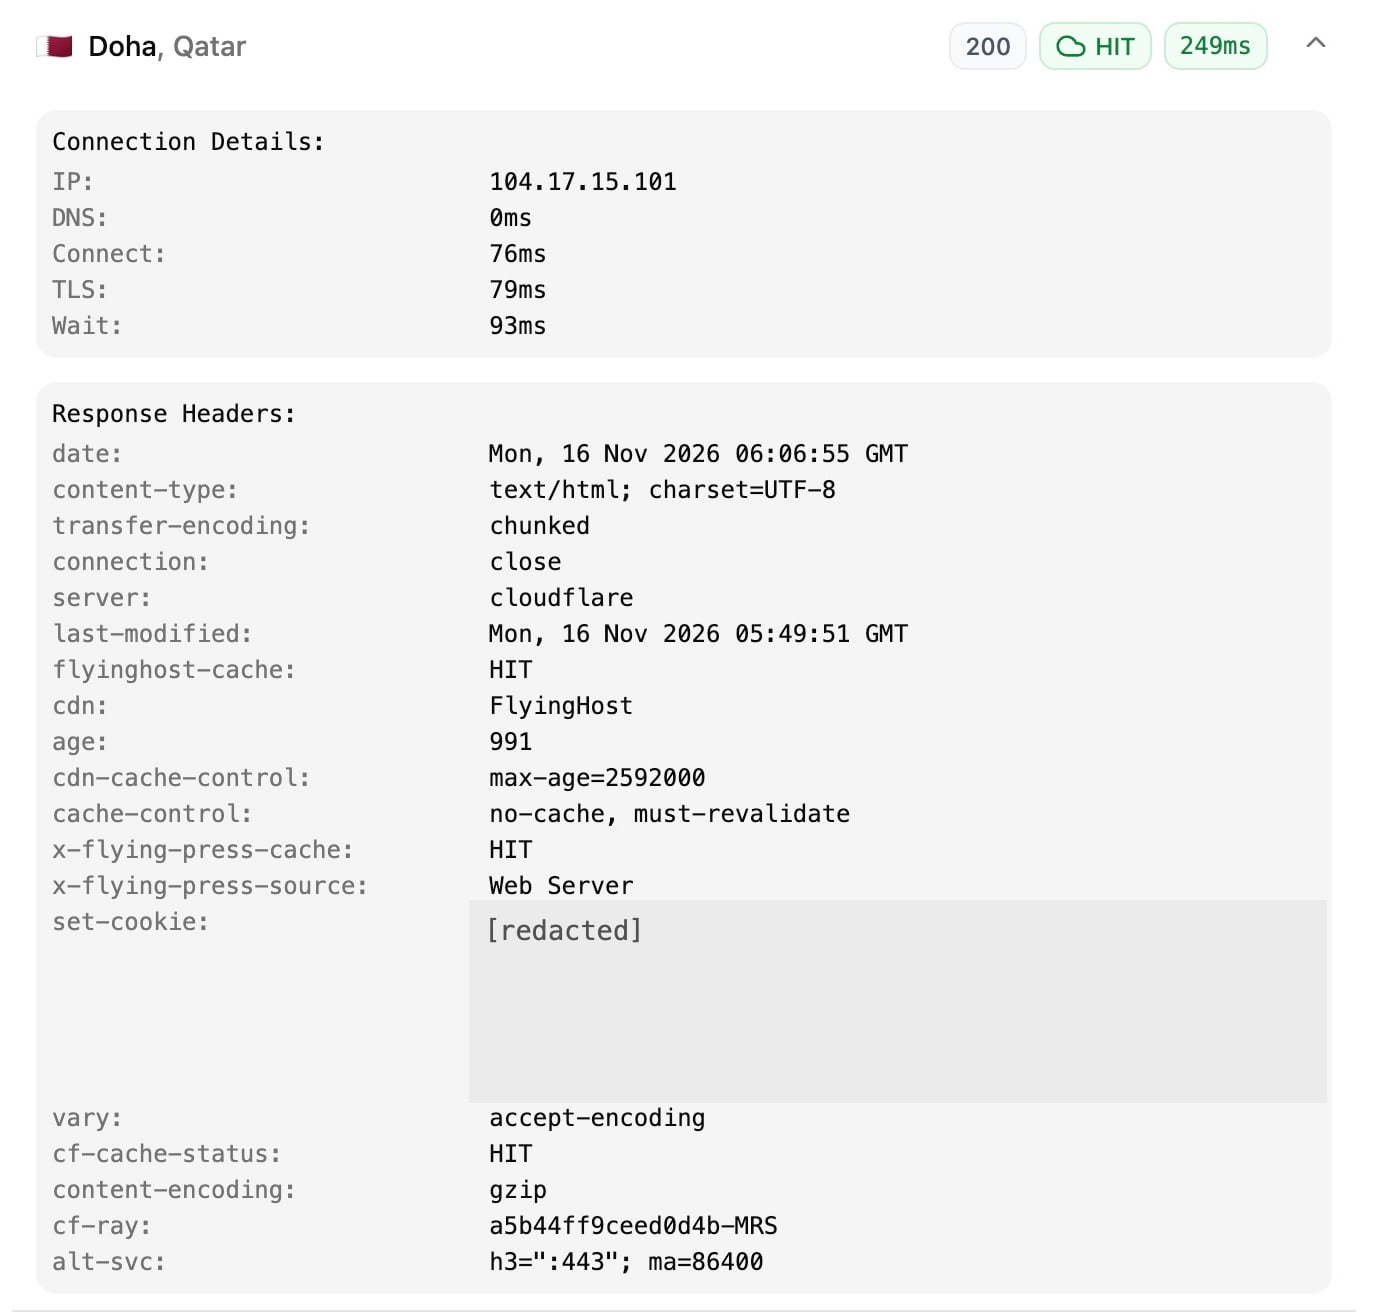
Why was Doha slower? I opened the result and saw that connecting took 76 ms and TLS took another 79 ms. The wait after the connection was ready was 93 ms. The response headers showed cf-cache-status: HIT.
If one location looks slow, run the same URL again and compare the results from that location. This gives you a better idea of whether the delay keeps showing up and which part of the request to look at first.
How to Check If Your CDN Is Caching the Page
While you’re looking at a result, you can check whether the CDN served the HTML from cache. On Cloudflare, cf-cache-status: HIT confirms a cached response. A MISS means Cloudflare didn’t have the response in cache for that request. If a public page keeps missing on repeat tests, check whether your CDN rules allow it to cache the HTML. Cloudflare’s cache status guide covers other values like DYNAMIC and BYPASS.
Try Flying TTFB on your site. It works with any public website, including WordPress blogs, online stores, and static sites. If you use WordPress, I’ve also written about how to reduce TTFB.
If you’re looking to speed up a WordPress site, FlyingPress is our plugin for caching pages and optimizing images, CSS, and JavaScript. On the hosting side, FlyingHost is our managed WordPress hosting with server caching and a built-in Cloudflare CDN.